Market Overview Q3

Hello traders, and welcome to Q3 in what has been one of the most interesting years in my trading career.

I wanted to put together a little overview of some super interesting market highlights that you may have missed, and what they could mean for the markets in the coming weeks, months and years.

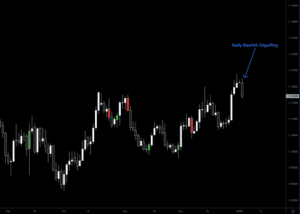
Oil Hits $100 p/barrel …again!

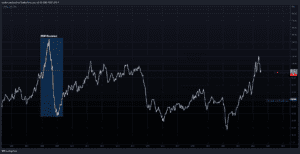
Firstly, I want to look at Oil.

The $100 price point, we can see is a historical “magnet” which price does not like to spend much time above. We must understand that oil is an essential ingredient in the stability of the modern world. Pretty much every industry needs oil, producing goods, shipping goods, selling goods… you get the idea.

When oil is expensive, cost of inputs rises, contributing to inflation. Inversely, if the price of oil falls, inflation may begin to fall. Low inflation usually signals low demand for good and services which can slow economic growth… which if paired with low employment data can trigger a recession.

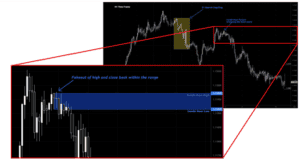
Looking back to the 2008 recession, we can see price spent some time above $100, before cascading lower. Citi are currently predicting a $60 p/barrel for oil before year end.
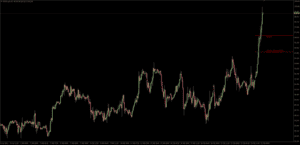
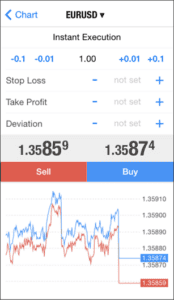
$EURUSD Parity!

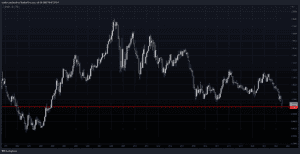
Last week the Euro fell to $1 for the first time in 20 years!

You could literally buy a 1 EUR for 1USD.

This move comes as a combination of a relatively week Euro, and an outrageously strong USD. The Euro pain seems to be coming from a cocktail of factors, most notably the fears of Moscow cutting off supplies, and high European gas prices. On the other side of the currency pairing, the save-haven USD has benefitted from global uncertainty.

A recent editorial piece noted :
“The euro’s slide is a headache for the ECB. Allowing the currency to fall only fuels the record-high inflation the ECB is battling to contain. But trying to shore it up with higher interest rates could exacerbate recession risks.”
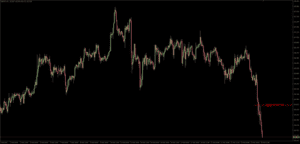
 

$BTC Signals Low?

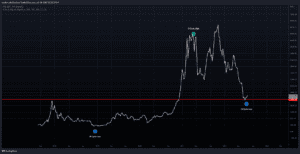
Moving away from tradfi and taking a look at $BTC. After falling 70% from the all time high, the degens favourite hedge against infaltion hits key support around $19k.
Recently this asset printed a Pi Cycle Low signal, an indicator which has successfully called both bottoms and tops in the asset.

That’s all for this week guys, if you’d like to get involved in our trading community, click here!
Or for any of our online courses, click here!

Until next week, safe trading!

Sam

Market Bubbles & Crashes

Dot-Com Bubble Chart source:www.marketwatch.com

In-light of everything going on in the crypto space… let’s talk about market bubbles. #btc #ust #eth

Above is a chart of the Dot-com bubble.

Peaking around 2000, this stock market bubble came on the back of excessive speculation of Internet-related companies in the late 1990s.

The problem with a rapid price increase is that it attracts media attention and “hype” from ill-informed investors who steam into the markets to try and ride the wave. This hype usually happens prior to the peak and further drives the price up. At this point, the wise/larger investors begin to take profits, creating selling pressure. Due to the ill-informed nature of the “hype” participants, they are like to exit on any sign of weakness, creating further selling pressure, leading to a crash.

Now if you got in around 1995, by the time we hit 2005, you’ve not lost anything. Likewise if you got in around 2002-2003, you’re alright, the market has peaked and now public perception, faith and interest has waned significantly, offering discounted priced for the wise investor. By the time we get to 2015, those who entered in 02,03 etc have all done really well.

My point: Just because a market has crashed, does not mean it’s dead, or failed. I believe in crypto long term, but this will come with market maturity which means less parabolic moves, and more consistent and sustainable climbs.

P.s. If you buy into an aggressive up move, you’re likely to lose long term.

*NOT FINANCIAL ADVICE*

Until next week, safe trading!

Sam

Price Action Entries

Not all trades are executed with a pending limit order, we have spoken about the different types of orders in a previous blog post so if you’re unsure about the difference between a limit order and a stop order go check that out first. This week we will be focussing on what price action constitutes a valid entry signal and we will look at the variations of how we play these. The following examples will show you how you can play each of these entry confirmations, it is up to you to backtest each approach and take the one that fits best to your style of trading. Entries which require market execution are more aggressive and may not be your trading style, whilst others are more conservation and play on momentum, let’s take a look.

The two price action entries we will be looking at today include;

  • Bullish/ Bearish Engulfing
  • Shooting star/ Hammer (+ thrust away)


Bullish/ Bearish Engulfing

The dotted grey lines highlight the range of the previous candle, why? Because for it to be an engulfing it must take out one extreme of the previous candle and then close beyond the opposite extreme, i.e. completely engulfing the previous candle.

The more aggressive approach here is to execute at market at the close of the engulfing. A more conservative approach would be to place a stop order at the extreme of the engulfing, this way you will be filled with the momentum of the market in your direction. If you are looking to get that cheap entry and increaser your R, however, you may be looking to opt for a short retracement to the naked high/low prior to the engulfing.

Shooting star/ Hammer (+ thrust away)

Why have I placed the thrust away in brackets? Simply because it is your discretion whether or not you wait for a thrust away after each of these price action entries. Waiting for a thrust away adds another layer of confluence, confirming the price action but at the same time this approach is a lot more conservative and you may miss out on some trades. Again, there are three options for hammers and shooting stars with regard to our entries.

Again, the dotted grey lines highlight the range of the previous candle, why? Because for it to be a hammer or a shooting star it must take out one extreme of the previous candle and then close back within the range of the previous candle.

Just as with the engulfing price action entries the more aggressive approach is to execute at market at the close of the hammer/ shooting star. A more conservative approach would be to place a stop order at the extreme of the hammer/ shooting star, this way you will be filled with the momentum of the market in your direction. If you are looking to play it safe, however, you may find it best to wait for a thrust away to confirm the price action and then opt for a limit order at the extreme of the hammer/ shooting star.

These are a couple of the simpler price action entries we trade, all of which offer multiple entries depending on your trading style, on another occasion we will take a look into inside bar failure in more detail as a means of price action confirmation. If you’d like to check out our education where you can get an in-depth look at how we trade, check it out here.


Until next week, safe trading!

Jake

Inside Bars

In the previous blog post we discussed a couple of different price action entries, we also looked at the different ways we can approach these. Whether that be a go-with approach or a retracement etc. This week we are going to focus on inside bars, these can be used as another price action entry and can also form a daily bias.

We will cover the following today:

  • Inside Bar (Inside Day)
  • Inside Bar Failure (Inside Day Failure/ Inside Hour Failure)

Inside Days

Inside Days are a daily pattern involving two daily candles, we have a day of trade, also known as the ‘mother candle’ and then the following day trades the whole day within the range of the previous day. This is a two-day bias suggesting a potential reversal. A great way to play these sorts of biases is to pre-empt the failure of this reversal, as well as playing the success of the inside day, so what does this look like? Let’s take a look at an example below.

In the following example we can see that the inside day occurs within a strong impulsive down move, this could suggest that we may see a reversal to the upside.


Let’s move onto the hourly time frame and take a look at the potential reversal.

We can see here that as soon as we get a break of structure, and a break of the inside day high, we see that conviction and strength of the reversal in a continuation to the upside. This is an example of a successful inside day, however, we must also be aware that these can easily fail. Therefore, price may fake out of one side, react from some significant structure and then proceed to reverse and take out the opposite extreme of the inside day. This takes us onto inside day failure and subsequently inside bar/hour failures.

As we have seen, with a successful inside day play, a lot of people are looking for that reversal of the down move after we print an inside day. We can use this approach on the lower time frames to predict trapped participants in the wrong direction.

In the second part to this post we are going to focus on using inside hour failures as a form of price action entry confirmation.

In this example we will be looking at a daily bearish engulfing giving us a short bias, next we need to head onto the lower time frame, in this example this will be the hourly time frame. For our entry confirmation.

After our daily bearish engulfing it is the inside hour failure that provides us with a nice entry to play the continuation of this engulfing. A simple way to approach this price action entry confirmation is to execute at market.

To summarise what we’re looking for with this type of price action what we want to see is an hour spent within the previous hours range, followed by a break of the upper extreme (i.e. a fakeout) before closing the hour back within the range of the inside bar (if looking for shorts, vice versa for longs).

Hopefully you can take some useful tips away from this, if you have any questions consider joining the KB Community  and learning with us!

Until next time,

Jake


Russia Attacks Ukraine

Forex Factory Headlines


What impact is this having on the markets?

  • Brent Oil has hit $100 a barrel for the first time since 2014
  • Gold reaches highs not seen in more than a year
  • USD, JPY and CHF assets have gained strength

Why do these assets gain strength during these times? The Japanese yen and the Swiss franc for example, are considered a safe haven assets, but why?

“The Swiss franc has remained a very attractive safe-haven currency, especially during times of market turmoil, mainly due to the stability of the Swiss government, as well as the very stable banking and financial system in Switzerland. The economy has a very low debt to GDP ratio. It also has a current account surplus, and it has largely maintained political neutrality, which means that is often unmoved by many of the foreign affairs, compared to some of the other developed economies…

Now, turning to Japan, the country also has a current account surplus, just like Switzerland, which means that it exports more then it imports, but the economy is not one that one would normally consider as being a safe-haven, as the country has a very high level of debt, basically sitting at almost 250% of GDP, and has been struggling with low inflation for the last couple of decades. Now, what makes Japan’s debt very different then other developed economies, is that most of their debt is held internally. Now that means that Japan is basically the world’s biggest creditor nation, meaning that it owns a lot more foreign assets then what it owes. There’s also some other reasons why the Japanese yen and the Swiss franc often appreciate during risk of flows, and that has to deal with the very low interest rates from both currencies… Thus, when the market turmoil hits… you’ll often see a very big repatriation of Japanese yen and Swiss francs… and a lot of outflows in your high beta currencies, like your EM currencies, as well as your more classic high betas, like your Aussie, your Kiwi, and your CAD. So that is some of the main reasons why the Swiss franc and the Japanese yen is considered safe-havens, and in terms of the attractiveness as funding currencies, why we often see them appreciate during times of risk-off, and depreciate during times of risk-on.” Source –https://financialsource.co/


CRUDE OIL

GOLD

GBPJPY

Jake

Trading From a Phone?


This is a stereotypical topic that you will see around social media, “trade to make a side income”, “make money on the beach from your phone”. So, is it actually possible?

Today I’m going to cover the apps that are available and the tools that are available to enable you to trade from your phone. Do I recommend it? Let’s see…

The three areas to focus on when looking to trade from your phone are the following;

  • Risk Management
  • Analysis
  • Execution

Risk Management

The first way we can go about managing our risk is by using websites such as Admiral Markets Risk Calculator . This is a simple and effective tool but we do have an option for an app on our phones, ‘Stinu’ is a risk calculator app that is very user friendly. This used to be free but they now require a small subscription fee of $14.99 per year with a 7-day free trial.


Analysis

Tradingview is probably the most user-friendly app you can use for analysis on your phone, it has most of the functions available just as on the web version but the issues that arise from analysis on a phone are the inability to view enough data on the screen and if we are completing our analysis on Tradingview on a different broker to the one we are executing on we run the risk of inaccuracy of price.


Execution

We execute on MetaTrader 4 or MetaTrader 5 on the trading floor through Admiral Markets as our broker. This is also possible on a phone as you can download MT4 or MT5, you can then execute on the app once you have connected your broker and entered your login details.


Conclusion

Therefore, in theory, yes, it is possible to trade from a phone. There are applications for each component necessary to trade and it physically can be done. Does that mean, however, that we recommend it? Absolutely not, these apps are useful in times when you may be out of the office or away from your desk setup, but even then, I would advise against making decisions away from your desk setup. These apps are useful should you need to trail a stop or if you needed to check to see if your lot size is accurate, not to initiate a trade from.

Until next week, safe trading!

Jake

Trading Flag Patterns

This week we are going to take a look at another well-known retail trading pattern. Like many of these patterns it’s knowing when to execute them that plays the significant factor within the success rate rather than the pattern itself working every time. The two types of flag patterns we will focus on today are of course the bullish flag pattern and the bearish flag pattern. These patterns are simply an impulsive move in one direction, followed by a period of consolidation before the second impulsive move in the same direction.

What we can see from the diagram above is a bullish flag pattern and a bearish flag pattern, however, a key point to note within these patterns is how the period of consolidation is actually counter to the trend. Within our ‘Bull Flag’ we have an impulsive move to the upside and then a period of consolidation where the market is making lower lows and lower highs, and vice versa for our ‘Bear Flag’. This is a very important factor to note during these flag patterns.

So, how do we trade these?

Flag patterns have a high probability of duplicating the first impulsive move on the second leg. We can, therefore, measure the distance of the impulse move and duplicate this for the second impulse. See diagram below.


In this example, the impulse move was 433 pips, we can therefore have a target of 433 pips from the low of the consolidation period of the flag pattern.

A simple way to trade these patterns is to wait for a break and retest of structure within the consolidation period, with a stop below the low of the consolidation and using our target of the initial impulse move. See example below, vice versa for a bearish flag pattern.

This is a fairly simple but effective market pattern trading with the trend and trading with momentum can often lead to quicker resolutions. This has been a sneak peek into the Advanced Trader Course , details on specific strategies are covered within the course if you would like to cover these aspects in more depth.

Until next week, safe trading!

Jake


KB Backtesting Guide

This week’s blog will be focussed on walking you through how we backtest here on the trading floor and the various tools we use. In the first section we will run through TradingView, this is a great platform that I have used in the past and is one of the most user-friendly backtesting tools I have used. The second section will be devoted to backtesting on MetaTrader4 (MT4), this has its drawbacks but also has a lot of positives over that of TradingView.


Section 1 – TradingView

Pros:

  • User-friendly
  • Abundance of tools and indicators
  • Effective replay tool between different time frames
  • Screenshot links

Cons:

  • Potentially unreliable data
  • Unrelated data to your live account
  • Adjustable zoom
  • Subscription fee


As we can see there are many features which make TradingView a great tool to use for backtesting historical data in order to determine the profitability of our strategy. The drawdowns to this platform, however, include potentially unreliable data. If you backtest on a different broker to the broker you use for your live trading you may achieve different results to your backtesting data. What may be a Daily Engulfing candle on Oanda may not be on an FXCM chart or on Admiral for example. There is also a monthly subscription fee to TradingView, although it isn’t that expensive compared to other platforms such as Forex Tester 5 . Even though the wide variety of tools is a positive aspect, I would also consider this as a potential drawdown, why? Simply because having all of these tools at your disposal only makes it more likely for you to include them on your chart. I am a big believer in as limited indicators and tools as possible in your trading, it only results in an overload of unnecessary information. For these last few reasons, I will backtest and gather my data on MT4, it is a little bit more ‘clunky’ and takes a period of time to get used to, but for the more reliable data it takes precedence for me.


Section 2 – MetaTrader4

Pros:

  • Reliable data to live trading
  • Fixed page fill
  • Simple screenshot feature to record results
  • Simple F12 to skip to next candle function
  • Completely free

Cons:

  • No replay function
  • More time consuming


As my live account with Admiral Markets is connected to MT4 I am able to gather stats and backtest on the exact same data I will be trading live. This adds another degree of accuracy to my results that you can’t get from TradingView. Let’s take a look a screenshot of GBPUSD on MT4 and we can walk through a few useful functions to help you backtest with this platform.


There are two key functions I have highlighted within this screenshot. These allow us to backtest and scroll back through the historical data. If you ensure that (1) is unclicked, you will be able to track back through past data, the second extremely useful function is (2), a little grey triangle along the bottom of the page along the date and time axis. The way this work is as follows, whatever time frame you are on, if you drag this arrow to a specific date and time and then choose a different time frame the chart will automatically jump to this point in time. This enables us to jump back to a specific point in time that we’re interested in and allows us to jump down from the daily time frame to the hourly time frame at the right place.

If you are still unable to see (2) on your chart you may need to change you grid colour settings. Simply right click on the chart and choose properties, these are the following settings that I use if you need a guide.


If you wish to take a screenshot this can be completed by right clicking on the chart again and selecting “Save As Picture”, if you ensure “Post image online in MQL5 Charts service and get the link” is ticked then it will open up the chart online and you will be able to save the link to your spreadsheet.


Once you have your chart opened to a certain point in time in the past you can simply view one candle at a time by pressing F12 on your keyboard, for some keyboards you may need to hold “Fn” and press F12 at the same time.

The final point to note is the fixed page fill I mentioned as a positive to MT4 backtesting, this may be a controversial standpoint but a big mistake made by many new traders, especially when using TradingView, is zooming so close in to the recent price action. This isn’t possible on MT4 and forces you to stay aware of past market structure which could have an impact on the trade you’re looking at. It forces you to look at the bigger picture.

I hope you have learnt some useful tips from this blog post, if you need any more help with MT4 or TradingView you can contact me on Instagram or Telegram and I am available within the KB Trading Community.

Until next week, safe trading!

Jake

Profitable With a 30% Strike Rate?


This week we’re going to take a look into risk management. Risk management allows us to have an edge in the markets even if we only win 30% of our trades. Imagine losing 70 trades out of 100 and still being in profit, it’s not actually as crazy as it sounds. We have touched on this a little in the past within a previous blog, but we’re going to look into this in more detail here.

First of all, we need to understand what risk management encompasses. The two key areas we are going to focus on today are the risk-to-reward at the trade outset and trade management once in a trade.

Risk-to-reward at trade outset

Different strike rates require a different average R to stay breakeven. Let’s take a look at the average R required for your strike rate:

If you have a strike rate of 50%, then your minimum average R to be breakeven is 1

If you have a strike rate of 40%, then your minimum average R to be breakeven is 1.5

If you have a strike rate of 30%, then your minimum average R to be breakeven is 2.33

If you have a strike rate of 20%, then your minimum average R to be breakeven is 4


We can see from this that simply incorporating a minimum risk-to-reward of 1:3 with a strike rate of 30% would actually enable us to be profitable over time. Take a look at the example below of an account size of £50,000 risking 1%.

In this first example you can see that when we lose, we lose £500. But if we win, just like in the second example below, we win £1,500.


If we did this 10 times and only won 3 trades, therefore having a 30% strike rate we would have the following results:

Losses = 7 x £500 = -£3,500

Wins = 3 x £4,500 = +£4,500

Overall = +£1,000

If we could simply increase our strike rate to 50% this would result in +£5,000 after 10 trades.

I wouldn’t recommend simply targeting 3R as the market doesn’t care where you get in or get out, the market will move based on liquidity. The biggest tip, therefore, would be to choose your target, stop and entry based on your strategy and if the risk-to-reward isn’t relevant to your strike rate then I would have this as filter to not take the trade.


Trade Management

Finally, even after seeing how we can still make money whilst losing 70% of our trades, there is another way that we can improve on this edge, trade management. If we can keep the same strike rate and the same minimum risk-to-reward but we implement trade management so that when we do lose, we lose –0.7R on average instead of –1R we can have an even greater edge.

If we look at the above example again with a 30% strike rate but now every time we lose we only lose an average of -£350 instead, after 10 trades we would be up +£2,050

We can more than double our edge with simple trade management whilst keeping the same strike rate and minimum average R.

If you want to learn how we manage our trades check out the Advanced Trader Video Course  where details such as this and much more are covered!

Until next week, safe trading.

Jake


Optimal Trading Environment

In order to ensure longevity within your trading career you need to surround yourself with the right people and have a trading environment that is conducive to constant progression and improvement. Without either of these two aspects you will learn bad habits and your learning curve will plateau. The markets are ever changing, albeit they may be subject to a sort of cyclical nature, they are nevertheless, ever changing.

What trading environment is best conducive to success?

Without a doubt the best environment you can surround yourself in is a professional trading environment and more specifically a proprietary trading environment. I have personally experienced the drastic changes to trading part-time alongside full-time work to full-time on a proprietary trading floor learning from those with 5+ years as professional traders in the financial markets. From the daily routines, to personal development and organisation it was eye opening to see. It may not be possible for you to experience this full-time but with the information within these blog posts it will hopefully allow you to have a better understanding of what is necessary and vital to have success within this industry.

Of course, in-person teaching is extremely valuable but it isn’t essential, it will speed up your learning curve exponentially but that isn’t to say it’s not possible without it. Having experienced professional traders available to you at a click of a button is, however, essential. If you’re not already a member of the KB Community or another trading community then I would strongly recommend that this is something you invest in. It will enable you to see the day-to-day life of the full-time traders and ask any questions you have that you may not be able to easily find online. Within the KB Community & Analysis Pass  you also gain access to all shared documents including daily plans, backtesting templates and stat gathering templates, all of which are invaluable to building a consistently profitable strategy.

A huge part of the many benefits included with the KB pass is the daily live streams, this will allow you to see how the professional traders break down the live markets and allows you to gain that experience of the full-time environment of a prop trader without actually being there in person.

Whether you are able to surround yourself with professional traders or not, a consistent place of study/ work is essential to building consistency, if you take control over the simple aspects to your process this will lead to consistency within your trading. What do I mean by this? If you ensure you are analysing the same markets each day, at the same time, in the same place and with the same approach then consistent results within your trading are more likely to follow suit.

The next area to explore would be what do I need for a perfect trading environment?

The stereotypical image of a trader is someone sitting in a chair with four keyboards in front of them and eight screens, is this really essential?

In all honesty, it depends, if you’re trading a 10-million-dollar account then maybe, yes. However, it is by no means essential to have so many screens. All you really need is either a laptop or a computer with an internet connection, it really is as simple as that. Multiple screens will allow for an easier flow between spreadsheets and the markets but isn’t something that you must have in order to be profitable.


A final key point to note is how important it is to have a good quality broker. What constitutes a good broker?


The following two points constitute a good quality broker:

  • A broker that is regulated by a financial body such as the Financial Conduct Authority (FCA), this simply means that the broker treats all consumers in compliance with the strict criteria laid out by the FCA and means you can trade safely.
  • Reliable customer service, this is paramount, you need to be able to easily contact your broker should any issues arise.

At KB we would recommend Admiral Markets as this is the broker we all use and trust.


Until next week, safe trading!

Jake