Abbreviation Handbook

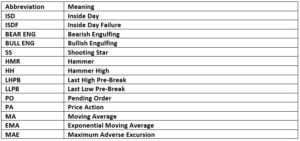
I have had a lot of questions recently about the different abbreviations used in the groups, I had thought about this type of blog post for a while but it seems it is in demand sooner rather than later. It will most likely be a short post but hopefully nice and informative. It may even be something you can take a screenshot of to refer back to until they all become second nature.


Further Information

I understand that sometimes even the meanings for the abbreviations can be confusing, so in this next short section I will explain what a few of the more difficult abbreviations are actually saying.


MAE (Maximum Adverse Excursion)

  • This is a calculation to determine how far a trade goes against you before running to target. We can use this in a few ways:
    1. To determine if we can tighten our stops, e.g if we calculate that our MAE for daily hammers is 25% we know our stops are too big and we are potentially leaving a lot of profit on the table.
    2. To determine if we can cut a losing trade early. Just the same as the previous example, if we calculate that our MAE for daily hammers is 25% and a trade on this bias is running 60% in drawdown we may look for an exit signal as we have the evidence to suggest that most of our winners on this bias only trade about 25% of the way to our stop.
    3. The third way we can use this statistic to our advantage is that it may suggest our entries aren’t correct. If we have a MAE of 60% we know we are entering the right trades still but not in the right place. We can use this stat to identify this issue.


LHPB/LLPB (Last High Pre-Break/ Last Low Pre-Break)

When leaving a pending order (PO) in the market this must be from a naked level for many reasons that we won’t cover here but in-depth explanations of market structure is outlined in the Advanced Trader Course.

When we are trading from a level we will often opt for the ‘cheaper’ trade by bidding/offering the LHPB/LLPB instead of the level itself, however, we may sometimes trade from the level depending on confluence.


I hope you found this blog useful, until next week.

Safe trading!

Jake

Prop Trader Daily Routine

Recently I have had a few enquiries into our daily routines as full-time prop traders. Looking up from the start of the journey as a beginner it can sometimes look a bit daunting and even unachievable to become a prop trader trading full-time. This is something we are trying to change with these blog posts and social media outreach, it enables you to get a sneak peek into our lives and what we do every day and to show you what it takes. This career path takes time and the only way to achieving consistent results is being consistent in your routine. The first ever blog post touched on how to achieve consistency so if you haven’t read that yet check that out here.


Daily Routine

We arrive in the office every morning at 7:15am latest, this requires waking up at around 6am for most of us each day. It is crucial for us to arrive at this time because it allows us to get set up for the day before the London open at 8am. We are able to take a much more objective approach to the markets when they are quieter, this is even more relevant when it comes to market preparation at the weekend when the markets are shut. When price is moving quite aggressively it can be difficult to think rationally and so it is by far one of the most important aspects to our day to be prepared before the London open. Being awake in time, getting showered and dressed, grabbing a coffee and making your way into an office mentally prepares you for the day ahead. Something that can be difficult is working from home, the easy option here is to wake up later, not shower and get ready and even trade from your bed perhaps, this is not preparing you to perform at the highest standard.


Organisation

Organisation is a huge factor that many people neglect. We will have folders organised for each asset we trade, the stats regarding each strategy, our daily plans, our weekly trade reports, the screenshots for the trades we’ve taken, the trades we’ve missed and so on.

It goes even further than just documents, we need to be organised to have the news ready to open at the tap of a button, correlation apps and even our broker information contact details in case anything goes wrong. This can often be overlooked, we deal with enough stress as it is, organisation reduces the stress we can control.


Market Understanding

Understanding when the markets you trade are quieter will allow you to plan your day more effectively. Therefore, for most of us trading currencies we know that there will be an increased period of volatility around the London open and then the New York open in the early afternoon UK time. If you are trading Gold you will notice this occur at 13:20 and with S&P 500 for example this will occur at 14:30 due to the cash open. Different assets will vary and so it is important you know the markets you trade in this way.

Up until around 10am we will allow ourselves time to concentrate on the live markets without other distractions, after 10am the markets are usually a bit quieter, this allows us to find some time for edge development. Whether that be gathering data, backtesting a strategy or watching an educational video. We will take breaks every few hours to grab a coffee or some fresh air and get away from the screens, it is just as important to take these breaks as it is to be focussed. We cannot function at 100mph every minute of the day and you shouldn’t be trying to do this either.

Something to bear in mind is the strategy you trade. We take a top-down approach to our trading (Weekly -> Daily -> Hourly) and it is on the hourly time frame where we execute and make our decisions, an important factor to note on this point is that we do not make a decision midway through an hour, so there is often very little benefit to watching the markets every minute of the hour if we are not going to make a decision based on this price movement. Therefore, this allows us to work on our edge development and then look at the markets 5-10 minutes before and after the hourly close to decide if we are going to make a decision.

Final Note

This pattern of edge development, checking the live markets and taking a little break will take us to around 5-6pm where we will finish the day with a review of what went well and what we could do differently to improve even further. Most of us will also go to the gym around this time as this is also another very important factor that people tend to neglect. You need to treat yourself as a high performing athlete, you may laugh at this but this is an extremely high-performance based job. We are up against the best of the best, against people that know 10x more than us, people that have 10x the amount of experience. We are all competing on the same stage, there is no beginner forex market for new traders to test. So, it is important we are doing everything we can to give ourselves an extra edge in the markets. Looking after your physical health will keep you sharp and ready to perform at the highest level you are able to.

A big aspect to remember is that this is a difficult and competitive career choice, you wouldn’t expect to become a judge and be on £250k per year within 6 months of training so why should you think that is the case for a trader?

And on that fairly holistic end to the blog post, stay hydrated and safe trading!

Until next week.

Jake
 

Must Have Indicators

Without a doubt we have all used a few too many indicators on our charts at one point in our trading, effectively hoping that these will provide some sign on where price is heading so we can pre-empt the next move.

Hopefully it has never led to anything as extreme as this, but you get my point. When do the indicators go from helping you to make a decision to preventing you from being able to make a decision?

There are hundreds of trading indicators from trend following, to oscillators, to volatility indicators or support and resistance indicators. But which ones are the most effective? How do we sort through what is beneficial to us?

First of all, we need to understand the difference between leading and lagging indicators:

  • A leading indicator predicts market moves; these indicators will react quickly to price action but this also makes them prone to false signals. A good example of a leading indicator is something like the Relative Strength Index (RSI). RSI is a momentum indicator; it allows us to determine if a market is overbought or oversold in the hope that we can use this as confluence for a reversal from this point. Unfortunately, as economist John Maynard Keynes said, “the markets can remain irrational longer than you can remain solvent” so just because something appears to be overbought or oversold doesn’t mean we will see a reversal.


  • A lagging indicator is a great confluence to confirm a trending market but is much slower to react to price movement. They provide information based on historical data but in a different way to what you are seeing on a candlestick chart for example. A popular lagging indicator is something such as a Moving Average (MA), a 20-period MA will take the average price over the past 20 periods, i.e. the total sum of the past 20 periods divided by 20 to give the average price at that point in time. The same goes for a 50 period MA but this will obviously have a longer delay than a 20 period MA.


What is the best indicator to use?

At KB we prefer to keep it simple, it is not to say that we won’t use a moving average from time to time as a confluence to a trade idea but they will not necessarily be on our charts all of the time. The only indicator that we all use is ATR (Average True Range). This is the only indicator that is on all of our charts all of the time.

What is ATR and what settings do we use?

If you are using MT4 (ATR indicator is not available for MT5) then you can get access to this through Tom Dante’s website, within his ‘educational material’ you can download his tool kit for free. From there follow these steps: Copy the ATR indicator > Open MT4 > Go to File > Open Data Folder > Open MQL4 > Open the Indicators Folder > Paste ATR file here > Close MT4 and open it again > You will be able to drag the ATR indicator from your indicators in your navigator folder onto each of your charts.

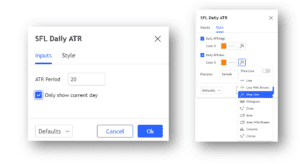
We use a 20 period Daily ATR as there are mostly 20 trading days per month so it provides an average range over the past months daily trading range.

If you are using Tradingview use ‘SFL Daily ATR’ with the following settings:

Why and how do we use ATR?

ATR is used as a confluence to a trade idea, it will also affect stop placements at times and sometimes even targets. I won’t be touching on the effect on stop placements or targets today but if you wish to go into more detail we cover this in the Advanced Trader Course and with this you will also have access to the team at KB to ask any questions you may have.

ATR is a strong confluence for our entries into trades, we do not require ATR to enter a trade but there are a few things we never do in relation to ATR. For example, we will never buy above upside ATR or sell below downside ATR. The reason for this is because by this point the market has already traded the average daily range, we are more likely to see a mean reversion from ATR than a continuation of aggressive price action because the market is deemed to be overextended beyond these prices.

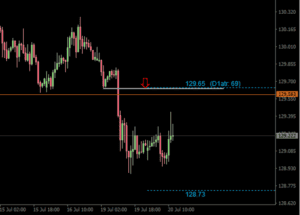
This does, however, provide a great confluence for a trade when we are looking to sell from upside ATR or buy from downside ATR because, as I just mentioned, we are more likely to see a mean reversion from this level. A good example from this week already is $EURJPY, the trade idea isn’t relevant in this example, but a couple of our traders here on the trading floor are looking to enter short from the daily level above market which is confluenced by ATR (see image below).

Hopefully there is some useful knowledge you can take away from this week’s blog, I am not saying that all other indicators are useless but be aware of what your indicator is telling you about the market. Simplicity is key.

Until next week, safe trading!

Jake


5R Trade Breakdown!

This week I checked back in with Grant to find out about one of his best trades, a 5% short in $AUDUSD.

@grant_jd_cameron

I plan to post more trades our traders have taken as I think it will be beneficial to see the some of these with a detailed breakdown of why they made certain decisions. It will hopefully also provide an insight into what we teach at KB if you are not already a member. If you would like to learn to trade the way we do we offer a very comprehensive Advanced Trader Course with over 20 video modules to help guide you through these methods. With this course you will also gain access to our three telegram groups and access to the team here at KB to ask any questions you may have!

Trade Breakdown

Grant Cameron

Asset: AUDUSD

Date: 31/03/20

Trade Idea: Daily Bearish Engulfing

P&L: +4.76%

Most of our trade ideas will start from the daily timeframe. The great thing about having a daily bias like we do in this example (Bearish Engulfing) is that we have a target based on this timeframe. We then drop down on to the hourly chart to pinpoint our entry and stop, with a daily target. These are the trades that provide a good risk to reward.

If we zoom in we can explain the bearish engulfing.

A bearish engulfing indicates that earlier on in the day buyers tried to push the market into prices higher than the previous day but failed to keep the market at these prices by the end of the day. By the end of day in fact, the sellers had pushed the market below the low of the previous day and this is where we then closed, engulfing the previous day’s range. You can see that we tried to rally into the daily level at 0.76682 but saw heavy rejection just ahead of this level so we can establish that this is occurring from a compelling location. We are now starting create a story behind this trade.

Our target is the next daily swing but after zooming out again we can see we have a double bottom in the market at 0.75620. Most traders will see this level as strong support now and therefore liquidity is likely to be building up below this level in the market as buyers stop losses and sell stops of breakout traders accumulate. Areas such as these have a high probability of being probed adding further confluence to the target.

By now we have our daily bias and our target sorted. The next step is to move onto the hourly time frame to see if we can find an entry and a valid stop location for the trade. (See below)

The blue box highlights the range of the bearish engulfing that we identified on the daily time frame. Moving to the hourly time frame Grant has drawn in two levels of interest (green lines), he identified the higher hourly level as being untested with Fibonacci confluence and therefore a valid place to put a sell limit to take it short down to the next daily level as we discussed previously. Grant was filled and we saw a shooting star rejection candle from his area of interest.

The ‘X’ marks Grant’s stop location at the beginning of the trade, it is above an hourly bearish engulfing and he believed that if price were to reach this level he would be wrong on the trade and the trade idea would no longer be valid. Stops can be trailed throughout the trade as long as these locations are valid and for good reason.

Grant was able to trail his stop on two occasions within this trade and I will explain the reasoning behind both.

The first opportunity to trail the stop occurs after the initial reaction from his order, price has confirmed a strong bearish reaction away from the level and he believes that price shouldn’t be getting back up to this level if we are as bearish as we think we are.

The second trailed stop is more subjective than the first. We have a rejection of the lower hourly level that grant highlighted before we see a close through the level, but we fail to close at a new low (i.e. we fail to close below the previous hourly low), this is the subjective part as by this point in the trade we are so close to target that Grant doesn’t believe we should be getting back above the level and that we are finished with this area.

As we can see, within the next 2/3 hours price trades nicely down to target. The reason we see such a strong punch through this level is due to what we discussed earlier about the double bottom. This is the liquidation of all the stops waiting below this “strong” support level.

I hope you enjoyed this breakdown and gained something from Grant’s trade here. Until next week!

Safe trading!

Jake

KB Trader Interview – Grant

Earlier on this week I sat down with Grant, one of the few Prop Traders on the trading floor in Glasgow, to talk about his journey. I knew this would be an interesting one and was very much looking forward to hearing how he ended up here with KB Trading.

We discuss Grant’s journey up until now but also go into detail on what he believes it really takes to make it as a trader with some helpful tips and pointers he has learnt from his experience so far.

Under Grant’s jovial exterior there is a very switched on, focused entrepreneur who will stop at nothing to achieve the goals he pursues as you will find out by the end of this interview.

If you want to follow Grant’s journey closer you can do so through his Instagram, he regularly shares inside snippets of the trading floor and day-to-day life as a Proprietary Fx Trader.

@grant_jd_cameron

Anyway, enough rambling. Enjoy!

Question: When did you first start looking into trading?
Answer:

I first looked into trading when I was about 14 years old, but it was never serious. I properly started looking into trading in January 2019 and I quickly fell in love with the statistical aspect to it. I love messing around with numbers and maths was always my strongest subject in school so it came quite naturally. I actually knew Sam prior to KB and so I spoke to him on the phone before joining. I took his course and joined the community ready to take it more seriously than I had previously.

Question: What were you doing before joining the trading floor in Glasgow?
Answer:

After 5th year (age 17) I left school and decided to become a joiner. Personally, I believed more in hard graft than I did in further education. I was ready to get my head down and get stuck into the real world. I worked as an apprentice and several jobs on the side in order to save up to buy a flat. I intended to buy to let, I renovated it myself and then rented it out, making a monthly income from this. I soon realised that the opportunity was in creating and running a business and so I sold this first flat and started my own company renovating and selling properties. Unfortunately, due to Covid it wasn’t financially viable to continue with.

Do you have any advice for those just finding their feet in trading?
Answer:

This is always a difficult question to answer because where do you start… One of the biggest things I could recommend is to be completely honest with yourself. Firstly, on how long the journey can take to reach consistency and also honest with regard to your backtesting . So many people will cheat themselves when trading back through the historical data doing things that they wouldn’t do live. It is all about creating a process that is repeatable. Another huge mistake new traders make is jumping between strategies and thinking something doesn’t work just because it hasn’t in the past three months. It can feel like a long time but in the bigger picture it really isn’t and this is where a lot of people go wrong, chasing the “next best thing”.

What are your aspirations for the next 6 months and few years?
Answer:

My main target for the next 6 months is to have more than half of those months up in profit. Within the next two or three years I would like to be settled and content financially but also just personally, such as living arrangements and so on. I would also like to take on a role within KB in the future, I really enjoy the teaching aspect as it is a very fulfilling role and something I believe I would be good at.

Any last things to add?
Answer:

*Inaudible expletive*

I think Grant meant to say good luck at the end and follow your dreams!

I am already excited to check back in with Grant later on in the year or at the beginning of 2022 and update everyone on how he is getting on and I hope you are looking forward to it too. If you enjoyed this be sure to give Grant a follow on his social media and check out the Advanced Trader Course we offer at KB. You never know, we could be seeing you on the trading floor describing your journey soon!

Safe trading!

Jake


Top Tips For Consistency!

Welcome to KB’s latest blog posts! I’m hoping these will provide helpful tips and give you some motivation to take your trading to the next level. I will dive into various aspects of trading within these posts. I will also be interviewing the prop traders here on the trading floor over the coming weeks as well so keep your eyes peeled for the ins and outs, the up and downs and some of the sacrifices it takes to become a consistently profitable trader. Enjoy!

In this week’s blog we are going to focus on what it takes to become a consistently profitable trader. This is a mountainous journey that many embark on but few reach the summit, so can we really identify what it takes to achieve the ultimate trading goal in one blog post?

The key to consistency is simplicity. If you make anything in life complicated you will no doubt struggle to achieve the desired result.

There is a great video that explores the deepest and darkest corners of consistency in the KB Advanced Trader Course (Watch a preview here) .

The first aspect to consistency is within your approach, are you approaching the charts in a consistent manner? For example, a top-down approach (Starting on the Higher Time Frame (HTF), Weekly, Daily and then Hourly for example) and are you doing this at the same time each day? At the end of the week are you preparing for the week ahead whilst the markets are shut? This allows you to really take a step back and look at the market structure without being distracted by the markets moving in front of you.

The second aspect I will highlight is routine, how can you expect your trading decisions to become consistent if you are not consistent in the times you trade, the markets you trade and the times you check these markets? For example, if you trade at the close of the hour, you must be checking the charts 5-minutes prior to the top of the hour in order to assess whether you need to make a decision.

A final point to mention is having a trading plan, this will keep you accountable for the trades you are taking. A trading plan should outline the markets you trade and exactly how you are going to trade the setups/ strategies that you have in place. These should be backed up by backtesting data so you can be sure that what you are implementing has at least worked over the past 4-5 years. This is something I could talk about in another post if people want to know the specific ins and outs of a professional traders’ trading plan?

Although this may have only just scratched the surface of consistency within your trading, I hope it has provided at least an introduction into what you can be doing differently to, at a minimum, ensure your approach to the markets is consistent.

If you would like to dive deeper into what it takes to be a professional trader, the KB Advanced Trader course is the natural next step. The education at KB has taken me from trading part-time at home to full-time here on the Glasgow trading floor.

Safe trading!

Jake