Hello traders, and welcome to Q3 in what has been one of the most interesting years in my trading career.
I wanted to put together a little overview of some super interesting market highlights that you may have missed, and what they could mean for the markets in the coming weeks, months and years.
Oil Hits $100 p/barrel …again!

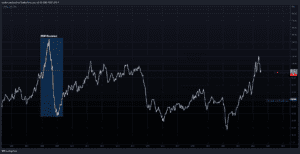
Firstly, I want to look at Oil.
The $100 price point, we can see is a historical “magnet” which price does not like to spend much time above. We must understand that oil is an essential ingredient in the stability of the modern world. Pretty much every industry needs oil, producing goods, shipping goods, selling goods… you get the idea.
When oil is expensive, cost of inputs rises, contributing to inflation. Inversely, if the price of oil falls, inflation may begin to fall. Low inflation usually signals low demand for good and services which can slow economic growth… which if paired with low employment data can trigger a recession.
Looking back to the 2008 recession, we can see price spent some time above $100, before cascading lower. Citi are currently predicting a $60 p/barrel for oil before year end.
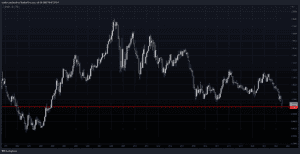
$EURUSD Parity!

Last week the Euro fell to $1 for the first time in 20 years!
You could literally buy a 1 EUR for 1USD.
This move comes as a combination of a relatively week Euro, and an outrageously strong USD. The Euro pain seems to be coming from a cocktail of factors, most notably the fears of Moscow cutting off supplies, and high European gas prices. On the other side of the currency pairing, the save-haven USD has benefitted from global uncertainty.
A recent editorial piece noted :
“The euro’s slide is a headache for the ECB. Allowing the currency to fall only fuels the record-high inflation the ECB is battling to contain. But trying to shore it up with higher interest rates could exacerbate recession risks.”
$BTC Signals Low?

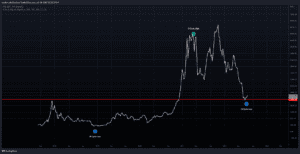
Moving away from tradfi and taking a look at $BTC. After falling 70% from the all time high, the degens favourite hedge against infaltion hits key support around $19k.
Recently this asset printed a Pi Cycle Low signal, an indicator which has successfully called both bottoms and tops in the asset.
That’s all for this week guys, if you’d like to get involved in our trading community, click here!
Or for any of our online courses, click here!
Until next week, safe trading!
Sam

