Trading & Full-time Work

This week we are going to cover whether it is possible to trade alongside a full-time job or full-time studies. The aim of this blog isn’t to crush your hopes and dreams of trading part-time to make a side income or to tell you how it is impossible to do this thing alongside other commitments, but I will be honest and transparent. There will be tips and areas to focus on in order to make this goal achievable in the long-term.

The first thing to note is that trading is extremely difficult to master but can also be extremely rewarding, the reason 85-95% of traders fail is down to unrealistic goals at the outset or a lack of discipline to stick to the process. Trading part-time will obviously take you longer to reach consistency than it would if you could devote yourself full-time, but, where that isn’t possible, following the steps within this blog should allow you to build a rigid plan and trading system that will carve the path to success.

Education

Another standout factor to those that fail to achieve anything within this industry is a lack of education or poor-quality education. People have unrealistic expectations that without any education they could be looking at making the same, if not more, than someone who is a qualified engineer with a degree. Most degrees take 3-4 years and even then a lot of jobs will require a masters, another 1-2 years of studying. Why should trading be any different? If it was that easy to make money in the markets without any education, wouldn’t everyone be doing it?

If you want to cut your learning curve in half, then some good quality education is an investment in yourself. You can look elsewhere online but KB offers a fully comprehensive series of education that can take you from a beginner all the way to a consistent trader. If you are new to trading then check out our Trading Forex Beginner Course , if you are a little more experienced in the market then check out our Advanced Trader Course  for more specific and detailed strategies. You can also purchase both courses at a discounted price with our Bundle Course option .

Have a plan

Having a plan relates to both a trading plan, consisting of every scenario from trading strategies to your broker’s number in the event of an emergency, and a study plan. Creating a plan for when you are able to study the education and test your strategies is paramount when trying to do this alongside something else full-time, create a realistic schedule of when you can study the markets and stick to it.

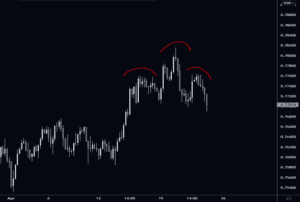
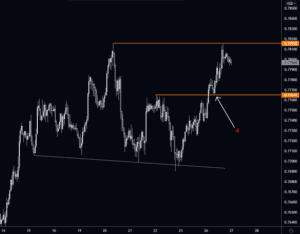
Ensuring you have a detailed trading plan is paramount to success, especially if you are only able to view the markets at certain hours during the day. Tip: You may want to consider implementing higher time frames into your strategy, trading from the daily or even weekly charts to understand your bias and then trading the four-hour chart for execution and management for example. You can’t expect to be able to manage on the 5-minute time frame with full-time commitments elsewhere.

Stick to a consistent strategy

Find something that is simple and easily adhered to, whether that be a strategy from a course or your own. Over-complicating a strategy will only make it impossible to stick to without fail. The simpler the better.

Realistic expectations

As we said at the beginning of this blog, this is the downfall of most people that give up and fail to make it within this industry. Having realistic expectations will keep you grounded.

So, what are realistic expectations?

Especially when learning alongside other full-time commitments some realistic expectations would include the following; trading demo for 12-18 months whilst you learn from the beginning and create a consistently profitable strategy, trading a small live account (funded or personal) for 6-months after this and then growing and/or achieving a larger funded account from here. A realistic goal for any consistent results would be around the 18-months to 2-year mark. Trading demo will allow you to make the necessary mistakes and learn from them without the pain of losing real money or blowing accounts at the beginning of your career and then with these lessons and market experience you will be ready to trade live capital.

Stop Losses

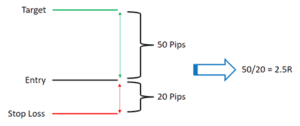
I almost feel that I shouldn’t need to mention this as I would expect this as a given. But, I will delve into this area anyway. Having a stop loss in the market is paramount, especially if you are unable to watch the markets all day. Capital preservation should be the priority of every trader compared to capital gain. The minute you stop thinking of how much a trade could make you and think about what is at risk and whether the risk is worth taking, then you will be that one-step closer to achieving consistency within your trading.

I hope you have found some use in this week’s blog, if you have any questions, you can contact our Facebook page on the website or our Instagram pages.

Until next week, safe trading!

Jake

The Traders Biggest Mistake


This one blog post could save you hours, days and maybe even months of unproductive work. There’s a big difference between working hard and working smart, I have definitely been guilty of this in the past. I have spent weeks investigating a new strategy or collecting data only for it to provide absolutely no edge and leave the data worthless. This is another factor altogether, there isn’t anything wrong with this necessarily, but following the advice within this blog post will hopefully save you days of mind-numbing testing and unrealistic results.

Let’s take a look at what we’re going to cover this week, do any of these topics relate to you?

  • Errors in backtesting
  • Moving to live capital too quickly
  • Removing/ moving stop losses
  • Seeing negative news and stepping in short

Errors in backtesting

I have been guilty of this at the start of my trading journey and I have seen it many times within the past year with new traders on the trading floor. Backtesting results may look good if you have an 80% strike rate and have made 100R per year, but are they realistic? Can you repeat these results in the live market? I would say, no.

Are you letting your ego take over when backtesting? Does hindsight play a big factor in your results? “Oh yeah I would have actually done that because of this in the market, I would normally get out here but because it’s now gone to target I wouldn’t have got out”. The simple, and harsh truth of this is that you will never consistently make money in the live markets until you are completely honest with yourself in your backtesting.

Top tips for this section

DO NOT;

  • get out at the highest point at the wick of a candle because it came so close to target, this isn’t a repeatable action in the live markets
  • change what you’re doing each trade
  • be dishonest with yourself, don’t ever use hindsight

DO;

  • create a process that is easily repeatable in the live markets
  • account for spread in your backtesting (this can impact your R more than you care to imagine, not accounting for this is going to prepare you for disappointment in your live results)
  • take screenshots of your trades (live and backtesting)
  • review your data once finished (don’t just clap your hands together and congratulate yourself on your hard work for completing 5-years of data, look back over your screenshots and identify common issues, areas for improvement etc.)


Moving to live capital too quickly

Too many people want to make “quick” money in the markets by investing £500 into a live account. If you can’t make money on a demo account consistently then why would live capital be any different? You’re better off investing in some good quality education and then sitting an FTMO challenge for £130, if you really are consistent you will achieve a £10k account with this and will be making a lot more money than you would from trading with your £500 account.

Moving to live capital before you’re ready can hinder your learning curve as you may be afraid to make certain decisions. You need to lose and make mistakes in order to learn, embrace a demo account and embrace losing trades, learn from these and don’t make the same mistake twice. You will be consistently profitable before you know it.

Removing/ moving stop losses

What good is a stop loss in the market if you’re going to remove it when price comes near it? If you haven’t accepted the risk, you shouldn’t be in the trade. This stems from a few factors such as a lack of confidence in the setup, if this is also the case, then you shouldn’t be in it either. Take time away from the live charts to test your strategies and theories, it will allow you to be a lot more confident in your execution.

Seeing negative news and stepping in short

We have seen this too many times as well, you see some negative news for the dollar for example and you decide that $USDJPY must be a definite winner if you step in short. We are technical traders, we use fundamental news only as a secondary tool. The following quote summarises this perfectly in my opinion:

The market can remain irrational longer than you can remain solvent.

John Maynard Keynes

I would like to leave you with one final quote to end this week’s blog post, this is a great quote from Stan Weinstein that every trader should implement within their trading:

Although the cheetah is the fastest animal in the world and can catch any animal on the plains, it will wait until it is absolutely sure it can catch its prey …it will wait for a baby antelope, and not just any baby antelope, but preferably one that is also sick or lame. Only then, when there is no chance it can lose its prey does it attack. That, to me is the epitome of    trading.

Stan Weinstein

Until next week, safe trading!

Jake

Pro Athlete Trading Tips


This week we thought it would be a great opportunity to look at how trading relates to professional sports. There are many more similarities than you would expect and one of the biggest aspects to this industry is the lifestyle it can bring; people see the high-flying traders who have the means to drive nice cars or go on holidays (albeit most of these people on social media are actually fake and are doing this to paint a lifestyle to sell a dream) but we’re excluding the fake gurus for this week as these aren’t the people we’re worried about.

What you see is the equivalent to watching someone like Tiger Woods, Lewis Hamilton or Roger Federer. All of these individuals make what they do seem effortless, performing at the highest level with what looks like ease, but what you haven’t seen is the daily practice for years and even decades to get to that point. And even the countless failures they have been through to achieve success.

I think the following quote from Mark Sptitz is the epitome of where people go wrong;

“If you fail to prepare, you’re prepared to fail.”

Let’s now dive into a few individual sportsmen and some of their best quotes and see how closely they relate to trading.

Tiger Woods – a professional golfer and one of the best to have ever played the game, Tiger Woods has won 82 official PGA Tour events and has won 15 majors.

“Winning is not always the barometer of getting better.” – Tiger Woods

How can we as traders relate to this?

I think this quote is a great reflection of what we do, you can be rewarded for doing the “wrong” thing, for example; holding a trade even though there was an exit signal and the trade then going to target. In this example you would be rewarded for poor management, you may get away with it this time but over the long run this will have a huge detrimental impact on your equity curve. A winning trade isn’t the barometer of good decision making. As I have said in previous blog posts, the process is more important than the individual results.

Lewis Hamilton – a seven-time world champion formula one racing driver, he also holds the records for the most wins, pole positions and podium finishes in the sport.

“What people tend to forget is the journey that I had getting to Formula One. There were plenty of years where I had to learn about losing and having bad races” – Lewis Hamilton

What can we as traders take from this?

You can look at professional traders and their amazing lives they live, but that is just traders at the top of their career, we cannot forget about all of the years that they failed to make money and all of the failures they had to push through to get to that stage.

I find this really helpful to think about during the tough times, if you can make it through these difficult times, the reward will be that much sweeter.

Roger Federer – all-time joint record holder of 20 Grand Slam singles titles in tennis.

“There’s no way around hard work. Embrace it.” – Roger Federer

Does this relate to trading?

Of course, just as much as any other quote this outlines what is necessary in order to achieve successful results in trading. If you are not willing to work hard then you will never achieve the results you dream to achieve, but if you do work hard then you might just survive in this game long enough to make something out of it.

The final quote I would like to highlight and leave you with is that from Michael Jordan:

“I’ve missed more than 9,000 shots in my career. I’ve lost almost 300 games. 26 times, I’ve been trusted to take the game winning shot and missed. I’ve failed over and over and over again in my life. And that is why I succeed.” – Michael Jordan

Use the failures to drive you on further, failures will only define you if you allow them to.

I hope you were able to take some motivation from the blog this week so until next week, safe trading!

Jake


Failure of a Retail Pattern

This week we are taking a look at how we capitalise on the failure of some typical retail trading patterns. This is not to say that these never work we play the failure every time, but knowing how to read the signs that the failure of the pattern is high probability allows us to capitalise on these in both directions.

Let’s jump straight into an example of $AUDUSD back in April 2021. The four-hour time frame isn’t generally one we will use to execute or analyse on but it can sometimes help neaten up the chart, in this example it allows us to clearly see the Head and Shoulders (H&S) pattern.

Moving onto the H1 time frame we get our first indication that this H&S could fail, a swing failure hammer at the neckline. What do I mean by this? We have a hammer that as pushed lower through the neckline of the H&S but has closed back above the level. Anyone with a sell stop on the neckline to get short playing on the successful completion of this pattern is immediately on the back foot.

The two horizontal rays on the chart highlight the highest point of the right shoulder and the head of this H&S pattern. Our first target would be the right shoulder and the second would be the head.

Even if you missed this entry there were still ample opportunities to enter, let’s take a look at some other entries that we could use to target the right shoulder.


Three possible entries:

1 – Swing failure hammer at the neckline of the H&S

2 – Bullish engulfing away from the neckline

3 – Hammer and a thrust away through structure, the entry here would be the retest of the H1 hammer head.

We have seen three possible entries to target the right shoulder but it doesn’t end there, even if you missed all of these entries, a play for the head of this H&S pattern is still valid.


A rounded retest of the right shoulder could provide a great trade up to the head to complete the failure of this H&S pattern.

If you would be interested in learning more about the strategies we trade on a day-to-day basis check out our Advanced Trader Course where we cover examples like this and much more.

Until next week, safe trading!

Jake


The Importance of Gathering Stats

Welcome to another blog post, this week we will be diving into the world of stats. If this is something that you don’t like, or don’t have an interest in, then I’m afraid you are going to struggle more than is necessary in your trading career. It can be a dull task gathering 4,5 or even sometimes 10-years of data but it can make a huge impact to your overall consistency, decision making and more specifically, your profitability.


Have you ever made a decision on gut feeling? Have you felt as though it was the right decision just because it saved you money or made you money? In contrast, have you ever made a decision and then hated yourself for it because it turned out to lose you money? The simple point to note is that you should never have these feelings because you should know, without any doubt, that every decision you make is because you have the stats and the data to suggest that the decisions you make work over time. For us on the trading floor, “over time” relates to a minimum of 4-years. If something hasn’t provided consistently profitable results over 4-years of data then maybe you shouldn’t be trading it. We touched on this topic of discussion a little in the first blog post on ‘Top Tips for Consistency’.

This also brings us nicely onto the first aspect to gathering stats:

  • The necessity of the sample size

Saying something worked 100% of the time because you gathered 4 results in the last month isn’t enough data to suggest that it will continue to work in the future. Whereas if you have 150 occurrences over the last 5-years of data that provides a stat of 60%, this is something you can use in your trading.

What are stats?

We can look at stats to provide general or specific data about a given setup or patter. Some of the aspects we may want to consider are;

  • Strike rate
  • Average distance travelled
  • Average drawdown
  • Average candle size; and
  • Most frequent day of the week

An important point to note, however, is that we need to go into these with an idea of what we want to find out. If you don’t have a purpose then you won’t find any benefit from general data. For example, you should be able to say at the end of it whether the idea you had has any merit. As we mentioned previously, it should be able to help your decision making because you now know how likely something is to occur. If you don’t know the probabilities of the outcome, how are you ever meant to decide whether it was the right or wrong decision?

What role do stats play in positive results and mindset?

Let’s take an example, this is a hypothetical stat that you shouldn’t take as fact.

Example

We have gathered the data that tells us that the chances of a daily bullish engulfing travelling 1x the range is 70% and the probability of the same bias travelling 2x the range is 20%. If our target turns out to be beyond 2x the range we may look to re-consider whether this is the right target for the trade. We have another valid target and an area of structure that lines up perfectly with 1x the range so we can use our stats to suggest that this may be the better option because we know that the chances of our first target being hit at more than 2x the range are only 20%. Whereas, our new target has a 70% chance of being tapped.

Having stats also allows us to manage our expectations accordingly. If we know that the setup we are looking at has a 45% strike rate and over the last 5-years has had a few periods where we have had 4 losers in a row, then after the third loser we can still remain confident in the setup because we know that this can be fairly common and it isn’t anything to be worried about.

Bonus

Finally, I want to leave you with something that doesn’t require hours and hours of mundane stat gathering but can help provide a realistic expectation within your own trading. The biggest issue we see all the time is chopping and changing strategies because traders get too caught up in the results from the present and recent past, by which I am talking about the last 3-6 months.

Below is a table that shows the probability of the number of consecutive losers in each 100-trade sample of your trading. Therefore, even with a strike rate of 55%, you still have an 83% chance of 5 losing trades in a row.

Sam posted a great video in the workshop group a couple of weeks ago on this topic, if you would like to view this you can access this and over 20 other educational videos within our Workshop Telegram Messenger group. This is available with our Community and Analysis Pass.

Until next week, safe trading!

Jake


Trading Sessions

Trading Sessions

Let’s take a look at some of the points we will be covering in this week’s blog:

  • Understanding the different trading sessions
  • When does volume increase?
  • Are commodities and indices affected in the same way as forex pairs?

We can split the 24-hour foreign exchange market into three trading sessions;

  • Asia session
  • London session
  • New York session

There will of course be overlaps in trading times, for example, the London open may be 08:00 BST and then the New York open at 13:00 BST, but this doesn’t mean that people in Europe stop trading at 13:00 BST. It allows us to develop an understanding of when we are likely to see an increase in volatility and when the assets we trade are more likely to make aggressive moves. The majority of trade occurs during the London and New York session. Therefore, we commonly see consolidation type price action during the Asia session. Let’s take a look at a recent example of $GBPJPY.

Even though this is a Yen pair we can clearly see the increased volatility of trade in the London and New York sessions. The green box highlights the New York session on 8th September 2021, the blue box highlights the overnight Asia session and finally the red box highlights the current price action we are seeing during the London open.


As I previously mentioned, we will have an overlap of trading sessions but for the most part we can use the following diagram to illustrate the different trading hours that we see in a 24-hour period rotation 5-days per week.

Times below are BST.


Therefore, the market opens on Sunday 22:00 BST and then shuts for the weekend at 22:00 BST on the Friday.


When does volume increase?

Using the above understanding of the trading sessions, the example of $GBPJPY and the knowledge that most volume is trading in the London and New York sessions we can establish that we are likely to see increased volume and volatility at around 08:00 and 13:00 BST. If you want to see this happen on a fairly extreme scale simply watch the DAX on a 1-minute or a 5-minute chart at 8am. As soon as the clock ticks from 07:59:59 to 08:00:00 you will notice an extremely sudden surge in volatile price action. This brings us on nicely to talk about other indices/ commodities and how they are affected by these trading sessions.

When looking at European indices it is fairly self-explanatory that they will see an increase in volume around the London open, the same can be said for indices such as the S&P500 around the New York open. But we still have small variations that it can be useful to be aware of. This relates back to when the markets were traded in the “pits”, indices and commodities had renowned “pit” trading hours and these still have a major influence on the markets today.

Let’s take a look at a few examples which nicely illustrate the small nuances and fluctuations between the markets. As I mentioned with the DAX seeing increased volatility at 08:00 BST, we can see similar occurrences with the S&P500 at 14:30 BST. When looking at Gold this occurs at 13:20 BST and the same with Crude Oil at 14:00 BST.

The hour before these “opens” are known as the initial balance for the commodity/ index and is associated to the “pit” trading hours that occurred in the past.

I hope you have found some use in the blog post this week; I personally think that developing your understanding of the markets you trade in this way is an important aspect to fully developing as a trader. When you have an understanding of why things occur it enables you to be more equipped to deal with different situations. The market is unpredictable enough, the least we can do is understand how it functions.


I hope you have found some use in this, until next week. Safe trading!

Jake

Trading FAQ’s

Trading FAQ’s

This week we will take a look into some questions that you may not be able to find elsewhere easily. More often than not these are questions that people presume you know, sometimes the simplest questions are the most difficult to find the answers to.

I will provide a short list of the types of questions we will cover so you can skip ahead if there’s one in particular you would like to concentrate on:

  • How do I calculate my R on a trade?
  • What should my minimum risk-to-reward be?
  • Are there tools to look at the correlations of different assets?
  • What broker should I use?

How do I calculate my R on a trade?

First of all, what is ‘R’?

R is the fixed component related to your risk, whatever your risk per trade, this is your 1R. You should never lose more than 1R on a trade, if you risk 1% per trade and you make 2% on the trade, you have made 2R. Simple right? If you risk 2% per trade and you make 2% on the trade, you have made 1R even though you’ve made the same amount as the last example your risk was double.

Your R (i.e. your risk-to-reward) is calculated by dividing the total distance from your entry to your target by the distance from your entry to your stop loss. See the example below.


What should my minimum risk-to-reward be?

The determining factor to what your minimum risk-to-reward should be at the outset of your trade is your strike rate. Let’s look at some examples of what your minimum risk-to-reward needs to be to stay breakeven depending on your strike rate.

If you have a strike rate of 50%, then your minimum average R to be breakeven is 1

If you have a strike rate of 40%, then your minimum average R to be breakeven is 1.5

If you have a strike rate of 30%, then your minimum average R to be breakeven is 2.33

If you have a strike rate of 20%, then your minimum average R to be breakeven is 4


You can see that the lower our strike rate, the higher our average R must be in order to stay breakeven. What this doesn’t take into account, however, is risk management and exiting trades before we lose a full R. If we can have good trade management criteria in such a way that our average loser is no longer a full R, but rather –0.7R, for example, we could have a 40% strike rate with an average R of 1.5 and have a positive expectancy.

How?

Let’s look at this in an example.

After 100 trades, we have won 40 and lost 60 with a 40% strike rate.

60 losing trades multiplied by -0.7 gives us a total loss of -42R.

Now, 40 winning trades multiplied by an average winning R of 1.5 gives us a total gain of +60R.

Therefore, with simple risk management we could be up +18R from a risk-to-reward that before only gave us a breakeven expectancy.

If you would like to learn more about how we manage our trades and manage our risk, we cover this in detail in our Advanced Trader Course .


Are there tools to look at the correlations of different assets?

If you haven’t already read last week’s blog post on market correlations, go and check that out! A great website we use to check the correlations of our assets in Oandas Currency Correlation, you can check that out here .


What broker should I use?

Whether you’re looking to go live or trade a demo account, a good broker is extremely important.


So, what constitutes a good broker?

  • A broker that is regulated by a financial body such as the Financial Conduct Authority (FCA), this simply means that the broker treats all consumers in compliance with the strict criteria laid out by the FCA and means you can trade safely.
  • Reliable customer service is paramount, you need to be able to easily contact your broker should any issues arise.

Here at KB we trust and highly recommend Admiral Markets, if you would like to check out Admiral you can click the link here.

Other areas we will cover in future blogs include:

  • How do I properly calculate my lot size?
  • How do I place a trade in the live markets?


I hope you have found some use in this, until next week. Safe trading!

Jake

Market Correlations

This week we are focussing on market correlations, this is another aspect of trading that is crucial to understand but few properly do. We will cover areas such as:

  • What is correlation?
  • How do I find the correlation between two assets?
  • Should this impact the layout of my charts?
  • How do I use correlations in my trading?
  • Where can I learn more about this?


Defining correlation

Correlation is defined as a measure by which we can determine how two assets relate to each other, i.e. when one asset rallies, does the other asset also rally? We can look at this scale from –100 to +100

-100 being 100% inversely correlated

+100 being 100% correlated

A really nice example of how the assets we trade correlate to each other is by looking at three assets in particular for this example. If we take GBP/USD and USD/JPY we can use these two assets to calculate the price of GBP/JPY. Let’s look at this in more detail.

If we cancel USD from both sides we get GBP/JPY.

We can double check this, see the screenshot below of the three prices of these assets at a single point in time.

If we use the equation above then 1.37371 (GBPUSD) * 109.781 (USDJPY) should equal 150.807 (GBPJPY)

Don’t just take my word for it, try it!


How do I find the correlation between two assets?

A very user-friendly website provides a heatmap so we can see the correlations between assets. (You can check it out here).

When you click an asset it will show the correlations of everything else against this asset from the hourly up to the yearly correlation.


Should correlations have an impact on the layout of my charts?

I know a lot of traders use tradingview for their analysis but the trouble with tradingview is that all of your charts are in a column down the side of your page, you cannot see the correlations of your assets like this. This is something that is much clearer to see when using MetaTrader. Take a look at the screenshot below of the top left corner of my charts on MetaTrader, it allows me to see EURUSD correlated to USDCHF which we know inversely correlates and EURUSD against GBPUSD which we know has a strong positive correlation. It is important to have your charts set up in accordance with the correlations of your assets.


How do I use correlation in my trading?

Let’s look at a screenshot of a line graph on tradingview showing recent price action of EURUSD compared to USDCHF.

This shows a clear visual representation of how these two pairs are inversely correlated to one another. We can back this up by looking at the Oanda currency correlation, at this point in time it is saying that the correlation between these two pairs is –89% on the daily time frame. Obviously, this doesn’t stay the same at all times, but at the time of writing this blog, this is where the correlation is sitting at.

So, how do we use this?

The most important aspect to highlight here would be to use this information to reduce your correlated risk. If you had a trade idea to get long on EURUSD and a trade idea to get short on USDCHF, entering both trades would increase your correlated risk as if one fails the other one is likely to fail as well. Therefore, in this example, if you risk 2% per trade, in theory you now have 4% on one trade idea and so you are over risking.

Another way this could be used is to hedge against your bet on EURUSD increasing in price by also getting in long in USDCHF. However, this is not how we day/swing trade and is more common in hedge funds and longer-term investment portfolios.


Where can I learn more about this?

Sam is covering this in more detail and covering more examples in a workshop video that will be posted in our telegram workshop group. If you are not already a member you can access this and over 20 other educational videos within this group by subscribing to the KB Community & Analysis Pass  today!

Until next week, safe trading.

Jake

Order Types & Spread

Welcome back to another week, this week I am going to dive into the nitty gritty aspects of trading that people neglect but I believe could be having a huge negative impact on their trading for not knowing it.

This week we will be focussing on the different types of orders that can be placed in the market and when to account for spread.

Different type of orders in the market

An easy way to understand the different types of orders in the market is through this helpful diagram below.

A stop order is placed when you want price to continue in the same direction when it fills you. Whereas a limit order is when you want price to reverse and trade in the opposite direction once you’re filled. We will take this into more detail in the examples below.

When and where do we need to account for spread?

Think about this logically, spread is created by the brokers providing you with a bid price and an ask price so they will always have it better.

Think about it in this extreme example:

  • You’re wanting to buy/sell something that is worth £10
  • Your broker says they will let you buy it for £11 or sell it at £9

The spread here is £2, if you buy this “asset” right now and you sell it back to the broker straight away you will be buying it at £11 and selling it at £9, making a loss of £2. This is how spread  works in the markets.

You will always be making a loss if you make the exchange straight away in both directions so this should help when you think about which price you will be executed at as if you think you can be filled and exit the trade straight away in a small profit, you’re wrong… unfortunately.

Now we can look into the different orders in the market and where spread comes into play here.

Look at this trade example and we can talk about each of the orders in the market.

The green line in this example is our entry, the orange line is our stop and the red line above market is our target. All of these are individual orders in the market, so what are they?

The entry = Buy Limit

Why?

Because we want price to reverse once the order is filled, see diagram above.

So, at which price do we get filled?

If we a looking to buy here, and the broker will always make a profit on you if you were to execute in the opposite direction straight away, then you will be filled at the ask price and sell at the bid price.

*Key point to note: The bid price on your chart is current market price. The ask price will be the spread above current market price.

Therefore, the low of the candle in this example would need to push below our order however large the spread is until the ask price line tags our order. If the spread is 3 pips wide, the bid price (i.e. current market price) would have to trade 3 pips below our order before we are filled. How do we combat this? We would place our order at least 3 pips above the price we want to get in at.

The stop loss = Sell Stop


Why?

Because we want to sell back our position at this price as we deem our trade idea to no longer be valid. Remember from the diagram at the start, we cannot place a sell limit below current market price.

So, at which price do we get filled?

For a sell stop we will be filled at the bid price. If this were a stand-alone order without our original buy position, we would be selling at the bid price and buying back our position higher up at the ask price as the broker always has it better.

The target = Sell Limit


Why?

Because we are selling back our buy position and we cannot place a sell stop above current market price.

So, at which price do we get filled?

We will be filled at the bid price. If this were a stand-alone order, a sell limit, we would be filled at the bid because we would be buying back in loss at the ask price as the broker always has it better in immediate transactions.


Conclusion

In a long position we only need to account for spread at our entry. However, in a short position we would need to account for spread at our stop loss and target as we will be filled at the ask price on both occasions, it is only at our entry that we will be filled at the bid.

What does this mean?

This means that in a short position you will have to add spread to where you believe you are wrong, if you don’t, current market price won’t even have to reach your level to take you out of the trade as you will be taken out at the ask price.


I hope this makes sense, if you need any further help and guidance think about joining KB through our Advanced Trader Course , this provides video breakdowns and comes with guidance from myself and the rest of the team at KB, see you soon!

Until next week, safe trading.

Jake

KB Trader Interview – Tim

The second part to this series of interviews with the junior prop traders on the trading floor here in Glasgow is here! This week I had the pleasure of catching up with Tim, an ambitious 22-year-old and the newest of the proprietary traders on the trading floor. Tim’s progression in the past two months has been unbelievable to watch, his determination and worth ethic is unparalleled. He definitely has the right attributes required to succeed in this industry in my opinion. It is far from sunshine and butterflies at the moment but this is why we all thought it would be a great idea to open up and show you what really goes on behind closed doors at KB Trading. There is a great quote from author André Gide that I think beautifully illustrates Tim’s journey so far, “man cannot discover new oceans unless he has the courage to lose sight of the shore.” Tim has left his family, friends and secure job back in Nottingham to move up and pursue a dream job of his in Glasgow. As the quote implies, you have to leave your comfort zone in order to truly discover new and amazing opportunities without the guarantee of actually ever discovering anything. It is a brutal industry that will chew you up and spit you out if you don’t have the determination to push through when times get tough, but Tim is not short of determination.

If you want to follow Tim’s journey closer you can do so through his Instagram, he regularly shares inside snippets of the trading floor and day-to-day life as a Proprietary Fx Trader.

@tim_chamb.kb

Anyway, enough rambling. Enjoy!

Question: When did you first start looking into trading?

Answer:

My introduction to trading was very stereotypical I think, making an easy side income and all the flashy cars etc that supposedly comes with trading is obviously appealing and did draw me in in the beginning. I’ve had my fair share of losing money in signal groups and even inadvertently finding myself involved in one of those pyramid schemes where you can make money from signing people up. I didn’t ever follow through with this as I didn’t agree with it, I knew this wasn’t what trading was really all about, this side of the industry is the fake advertising and it does unfortunately tar the rest of the industry. I knew from here that if I were to go anywhere with trading, I would need some proper education. This is where I turned to KB for help.


Question: Have you completed any trading education?

Answer:

Yes, after finding KB Trading through youtube I was really drawn in by the honesty that Sam portrays, I knew that there must be people that really are making this work and I knew it wasn’t true seeing people trade for 30-minutes a day on a beach in the Bahamas. I purchased the bundle option that KB offers and I think my trading journey really began there. A few months later I was accepted onto the junior prop trader role and moved up to Glasgow.

Question: What were you doing before you moved up to Glasgow to join the trading floor?

Answer:

I was working in construction for 6 years before joining KB, it was a safe and secure job but I didn’t see longevity in it. I didn’t have the passion that I have for trading so I was willing to take the plunge and take the risk.

Question: Can you give us an insight into some of the sacrifices you are making to pursue this dream?

Answer:

In order to manage all of my outgoings and costs of living I am having to work night shifts at the weekend. I am working a few evening jobs after trading in the office during the week and then two or three night shifts from 10pm-8am at the weekends. Sometimes I am leaving work to go straight to work. Even though the work in the office on the trading floor doesn’t necessarily feel like work, it is very mentally draining whereas the weekend night shifts are physically draining. I want to pursue a career in trading and I know it will take a lot of hard work but I am willing to make these sacrifices.

Question: In your opinion, what does it take to be a trader?

Answer:

In my opinion the most important trait to have as a trader would be resilience, you are going to have setbacks and even times where you feel like giving up but it is at these moments where you either crumble and give up, or push through and work on what went wrong. I think it would be very difficult to find a professional trader in this industry that hasn’t been through very difficult times during their career. It takes years to really achieve the level of consistency we are all searching for, it’s just whether you can fight it out and keep getting up after being knocked down.

Question: What are your aspirations for the next 6 months?

Answer:

If I can have two profitable months out of the next six, I will be happy. I hope to be at a stage where I can feel confident in my own trading to potentially embark on an FTMO challenge as well.


I hope you enjoyed this interview and took something away from it. I think the standout point within this interview that I noticed was the sheer resoluteness of Tim to not give up and to do anything it takes to give himself the best opportunity possible. There is no doubt how much value there is from trading live on the trading floor. Tim has even said to me that what he thought he knew of trading before arriving in Glasgow was nowhere near the level he noticed the first day he arrived on the trading floor.

This ends the second of the junior prop trader interviews, next on my list is Alex so stay tuned for that coming in the following weeks. I’m looking forward to catching up with Grant and Tim for another interview in the future to see where they are then and how far they’ve come.

Until next week, safe trading!

Jake

Beginners + Advanced Course