Trading FAQ’s
This week we will take a look into some questions that you may not be able to find elsewhere easily. More often than not these are questions that people presume you know, sometimes the simplest questions are the most difficult to find the answers to.

I will provide a short list of the types of questions we will cover so you can skip ahead if there’s one in particular you would like to concentrate on:
- How do I calculate my R on a trade?
- What should my minimum risk-to-reward be?
- Are there tools to look at the correlations of different assets?
- What broker should I use?
How do I calculate my R on a trade?
First of all, what is ‘R’?
R is the fixed component related to your risk, whatever your risk per trade, this is your 1R. You should never lose more than 1R on a trade, if you risk 1% per trade and you make 2% on the trade, you have made 2R. Simple right? If you risk 2% per trade and you make 2% on the trade, you have made 1R even though you’ve made the same amount as the last example your risk was double.
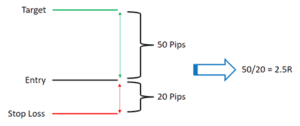
Your R (i.e. your risk-to-reward) is calculated by dividing the total distance from your entry to your target by the distance from your entry to your stop loss. See the example below.
What should my minimum risk-to-reward be?
The determining factor to what your minimum risk-to-reward should be at the outset of your trade is your strike rate. Let’s look at some examples of what your minimum risk-to-reward needs to be to stay breakeven depending on your strike rate.
If you have a strike rate of 50%, then your minimum average R to be breakeven is 1
If you have a strike rate of 40%, then your minimum average R to be breakeven is 1.5
If you have a strike rate of 30%, then your minimum average R to be breakeven is 2.33•
If you have a strike rate of 20%, then your minimum average R to be breakeven is 4
You can see that the lower our strike rate, the higher our average R must be in order to stay breakeven. What this doesn’t take into account, however, is risk management and exiting trades before we lose a full R. If we can have good trade management criteria in such a way that our average loser is no longer a full R, but rather –0.7R, for example, we could have a 40% strike rate with an average R of 1.5 and have a positive expectancy.
How?
Let’s look at this in an example.
After 100 trades, we have won 40 and lost 60 with a 40% strike rate.
60 losing trades multiplied by -0.7 gives us a total loss of -42R.
Now, 40 winning trades multiplied by an average winning R of 1.5 gives us a total gain of +60R.
Therefore, with simple risk management we could be up +18R from a risk-to-reward that before only gave us a breakeven expectancy.
If you would like to learn more about how we manage our trades and manage our risk, we cover this in detail in our Advanced Trader Course .
Are there tools to look at the correlations of different assets?
If you haven’t already read last week’s blog post on market correlations, go and check that out! A great website we use to check the correlations of our assets in Oandas Currency Correlation, you can check that out here .
What broker should I use?
Whether you’re looking to go live or trade a demo account, a good broker is extremely important.
So, what constitutes a good broker?
- A broker that is regulated by a financial body such as the Financial Conduct Authority (FCA), this simply means that the broker treats all consumers in compliance with the strict criteria laid out by the FCA and means you can trade safely.
- Reliable customer service is paramount, you need to be able to easily contact your broker should any issues arise.
Here at KB we trust and highly recommend Admiral Markets, if you would like to check out Admiral you can click the link here.
Other areas we will cover in future blogs include:
- How do I properly calculate my lot size?
- How do I place a trade in the live markets?
I hope you have found some use in this, until next week. Safe trading!
Jake