This week we are focussing on market correlations, this is another aspect of trading that is crucial to understand but few properly do. We will cover areas such as:
- What is correlation?
- How do I find the correlation between two assets?
- Should this impact the layout of my charts?
- How do I use correlations in my trading?
- Where can I learn more about this?
Defining correlation
Correlation is defined as a measure by which we can determine how two assets relate to each other, i.e. when one asset rallies, does the other asset also rally? We can look at this scale from –100 to +100
-100 being 100% inversely correlated
+100 being 100% correlated
A really nice example of how the assets we trade correlate to each other is by looking at three assets in particular for this example. If we take GBP/USD and USD/JPY we can use these two assets to calculate the price of GBP/JPY. Let’s look at this in more detail.

If we cancel USD from both sides we get GBP/JPY.

We can double check this, see the screenshot below of the three prices of these assets at a single point in time.

If we use the equation above then 1.37371 (GBPUSD) * 109.781 (USDJPY) should equal 150.807 (GBPJPY)
Don’t just take my word for it, try it!
How do I find the correlation between two assets?
A very user-friendly website provides a heatmap so we can see the correlations between assets. (You can check it out here).
When you click an asset it will show the correlations of everything else against this asset from the hourly up to the yearly correlation.
Should correlations have an impact on the layout of my charts?
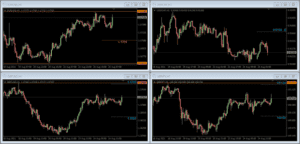
I know a lot of traders use tradingview for their analysis but the trouble with tradingview is that all of your charts are in a column down the side of your page, you cannot see the correlations of your assets like this. This is something that is much clearer to see when using MetaTrader. Take a look at the screenshot below of the top left corner of my charts on MetaTrader, it allows me to see EURUSD correlated to USDCHF which we know inversely correlates and EURUSD against GBPUSD which we know has a strong positive correlation. It is important to have your charts set up in accordance with the correlations of your assets.

How do I use correlation in my trading?
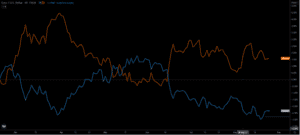
Let’s look at a screenshot of a line graph on tradingview showing recent price action of EURUSD compared to USDCHF.

This shows a clear visual representation of how these two pairs are inversely correlated to one another. We can back this up by looking at the Oanda currency correlation, at this point in time it is saying that the correlation between these two pairs is –89% on the daily time frame. Obviously, this doesn’t stay the same at all times, but at the time of writing this blog, this is where the correlation is sitting at.
So, how do we use this?
The most important aspect to highlight here would be to use this information to reduce your correlated risk. If you had a trade idea to get long on EURUSD and a trade idea to get short on USDCHF, entering both trades would increase your correlated risk as if one fails the other one is likely to fail as well. Therefore, in this example, if you risk 2% per trade, in theory you now have 4% on one trade idea and so you are over risking.
Another way this could be used is to hedge against your bet on EURUSD increasing in price by also getting in long in USDCHF. However, this is not how we day/swing trade and is more common in hedge funds and longer-term investment portfolios.
Where can I learn more about this?
Sam is covering this in more detail and covering more examples in a workshop video that will be posted in our telegram workshop group. If you are not already a member you can access this and over 20 other educational videos within this group by subscribing to the KB Community & Analysis Pass today!
Until next week, safe trading.
Jake

