Without a doubt we have all used a few too many indicators on our charts at one point in our trading, effectively hoping that these will provide some sign on where price is heading so we can pre-empt the next move.
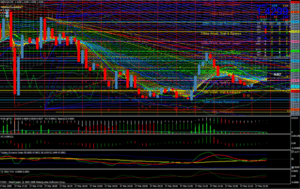
Hopefully it has never led to anything as extreme as this, but you get my point. When do the indicators go from helping you to make a decision to preventing you from being able to make a decision?
There are hundreds of trading indicators from trend following, to oscillators, to volatility indicators or support and resistance indicators. But which ones are the most effective? How do we sort through what is beneficial to us?
First of all, we need to understand the difference between leading and lagging indicators:
- A leading indicator predicts market moves; these indicators will react quickly to price action but this also makes them prone to false signals. A good example of a leading indicator is something like the Relative Strength Index (RSI). RSI is a momentum indicator; it allows us to determine if a market is overbought or oversold in the hope that we can use this as confluence for a reversal from this point. Unfortunately, as economist John Maynard Keynes said, “the markets can remain irrational longer than you can remain solvent” so just because something appears to be overbought or oversold doesn’t mean we will see a reversal.
- A lagging indicator is a great confluence to confirm a trending market but is much slower to react to price movement. They provide information based on historical data but in a different way to what you are seeing on a candlestick chart for example. A popular lagging indicator is something such as a Moving Average (MA), a 20-period MA will take the average price over the past 20 periods, i.e. the total sum of the past 20 periods divided by 20 to give the average price at that point in time. The same goes for a 50 period MA but this will obviously have a longer delay than a 20 period MA.
What is the best indicator to use?
At KB we prefer to keep it simple, it is not to say that we won’t use a moving average from time to time as a confluence to a trade idea but they will not necessarily be on our charts all of the time. The only indicator that we all use is ATR (Average True Range). This is the only indicator that is on all of our charts all of the time.
What is ATR and what settings do we use?
If you are using MT4 (ATR indicator is not available for MT5) then you can get access to this through Tom Dante’s website, within his ‘educational material’ you can download his tool kit for free. From there follow these steps: Copy the ATR indicator > Open MT4 > Go to File > Open Data Folder > Open MQL4 > Open the Indicators Folder > Paste ATR file here > Close MT4 and open it again > You will be able to drag the ATR indicator from your indicators in your navigator folder onto each of your charts.
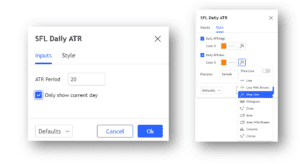
We use a 20 period Daily ATR as there are mostly 20 trading days per month so it provides an average range over the past months daily trading range.
If you are using Tradingview use ‘SFL Daily ATR’ with the following settings:
Why and how do we use ATR?
ATR is used as a confluence to a trade idea, it will also affect stop placements at times and sometimes even targets. I won’t be touching on the effect on stop placements or targets today but if you wish to go into more detail we cover this in the Advanced Trader Course and with this you will also have access to the team at KB to ask any questions you may have.
ATR is a strong confluence for our entries into trades, we do not require ATR to enter a trade but there are a few things we never do in relation to ATR. For example, we will never buy above upside ATR or sell below downside ATR. The reason for this is because by this point the market has already traded the average daily range, we are more likely to see a mean reversion from ATR than a continuation of aggressive price action because the market is deemed to be overextended beyond these prices.
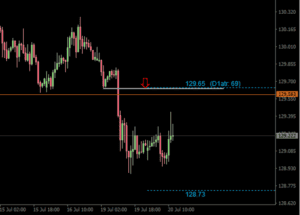
This does, however, provide a great confluence for a trade when we are looking to sell from upside ATR or buy from downside ATR because, as I just mentioned, we are more likely to see a mean reversion from this level. A good example from this week already is $EURJPY, the trade idea isn’t relevant in this example, but a couple of our traders here on the trading floor are looking to enter short from the daily level above market which is confluenced by ATR (see image below).
Hopefully there is some useful knowledge you can take away from this week’s blog, I am not saying that all other indicators are useless but be aware of what your indicator is telling you about the market. Simplicity is key.
Until next week, safe trading!
Jake